Cashflow
Structured guidance and evidence-ready outputs.
Cashflow modelling under scrutiny: what TR24/1 expects from your projections
765 firms use CFM tools but the FCA found inconsistent application. TR24/1 demands stress testing, longevity analysis and clear communication.
By Plannetic Research
Highlights
CFM usage
765
Firms using cashflow modelling tools out of 977 surveyed.
CFL tools
596
Firms using capacity for loss tools.
Stress gaps
Common
Longevity and inflation stress testing inconsistent.
What the FCA reviewed
The FCA's data survey of 977 firms revealed the scale of third-party tool dependency in retirement income advice. 765 firms used cashflow modelling tools, 596 used capacity for loss tools, and 842 used risk profiling tools (paragraph 4.26). Only 46 firms — under 5% — did not use any third-party tools at all. Cashflow modelling has become central to the retirement advice process, and the FCA wanted to understand whether it was being used consistently and effectively.
The review examined whether CFM outputs were used consistently across cases, whether projections included appropriate stress testing, whether results were clearly communicated to clients, and whether CFM output was integrated into suitability evidence. The findings revealed significant variation. Some firms used CFM as a core analytical tool, running multiple scenarios and stress tests that directly informed the recommendation. Others used it as a presentation aid, generating a single projection that illustrated the recommendation but did not test its robustness.
This distinction matters because it determines the quality of the advice. A cashflow model that shows only the expected outcome tells the client what might happen if everything goes to plan. A model that shows the range of possible outcomes — including adverse scenarios — tells the client what might happen when things go wrong. For retirement income clients, where the downside is running out of money in their 80s or 90s, understanding the adverse scenarios is arguably more important than understanding the central case.
Good vs poor practice
The FCA identified clear good practice: firms using CFM with multiple scenarios showing different market conditions, stress testing for poor sequence of returns in early drawdown years, modelling the impact of charges on drawdown longevity, and illustrating what happens to income if the client lives significantly beyond average life expectancy (paragraphs 2.14–2.22). These firms used CFM as an analytical tool that informed the recommendation, not just a chart that illustrated it.
Poor practice took several forms. Some firms presented cashflow projections showing a "95% chance of maintaining income to average life expectancy" without explaining what happens in the 5% failure scenarios, what the consequences are if the client lives longer than average, or what income reduction would be required to improve the probability (3.18). This gives clients a false sense of security. A 95% probability sounds reassuring until you realise that 1 in 20 outcomes involves the client running out of money.
Other firms used deterministic projections — a single assumed growth rate applied each year — which do not capture the impact of volatility on drawdown portfolios. A fund growing at a steady 5% per year behaves very differently from a fund averaging 5% but experiencing a 20% fall in year two. For accumulation investors, the end result may be similar. For drawdown investors taking regular withdrawals, the sequence of returns materially affects how long the fund lasts. Deterministic projections mask this risk entirely.
The longevity blind spot
Most cashflow modelling stops at average life expectancy. For a 65-year-old man, that might be around 85. The projection shows whether the fund sustains income to that age, and if the answer is yes, the adviser and client may both feel comfortable. But 50% of people live beyond average life expectancy — that is what average means. A significant proportion will live to 90, 95, or beyond.
The FCA wants firms to model what happens at extended ages. What does the fund look like at 90? At 95? At 100? What is the impact of 25 or 30 years of inflation on purchasing power? If the client needs £25,000 per year in today's money, they will need approximately £45,000 per year in 25 years at 2.5% inflation just to maintain the same standard of living. How does that interact with drawdown sustainability? When does the state pension start, and how much does it offset the drawdown requirement?
Tax is a further dimension that most projections handle poorly. A client drawing £25,000 from a pension and receiving £11,500 state pension has a combined income of £36,500, placing them in the basic-rate tax band. But if their drawdown need increases to compensate for inflation, they may cross into higher-rate territory, accelerating the depletion of the fund. These interactions between longevity, inflation, income, state pension, and tax are precisely what cashflow modelling should illuminate — and what TR24/1 found was often missing.
Monte Carlo and confidence bands
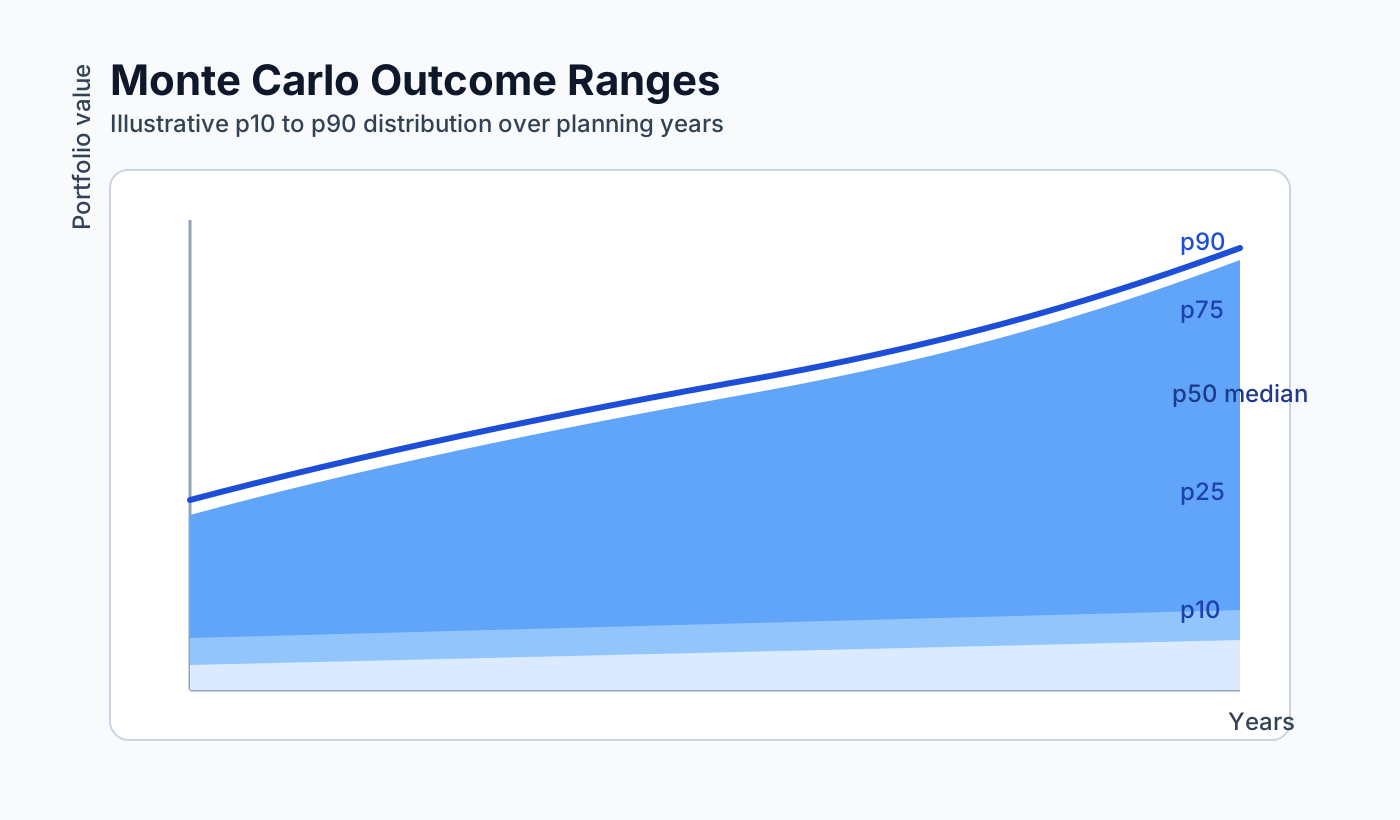
Monte Carlo simulation addresses the limitation of deterministic projections by running thousands of scenarios with randomised return sequences drawn from historical or expected distributions. Instead of a single projection line, the output is a probability distribution showing the range of possible outcomes. This is fundamentally more honest than a single projection, because it shows the client the uncertainty inherent in their plan.
A well-presented Monte Carlo output shows confidence bands: the 5th percentile (very poor outcome), 25th percentile (below average), 50th percentile (median), 75th percentile (above average), and 95th percentile (very good outcome). The client can see that in the median scenario their income is sustained to age 95, but in the 5th percentile scenario the fund is exhausted by age 82. This information is critical for informed decision-making. The FCA recognises Monte Carlo as stronger evidence precisely because it captures the range of outcomes rather than a single assumed path.
The challenge is communication. Probability distributions are not intuitive for most clients. "There is a 15% chance your fund will be exhausted before age 85" is a statistical statement, not a conversation. Good practice translates the numbers into practical terms: "In most scenarios, your income is secure well into your 90s. In a poor scenario — similar to the 2008 financial crisis happening in your first two years of drawdown — you might need to reduce your income by £3,000 per year to protect the fund's longevity." This connects the model to the client's lived experience and gives them a framework for understanding what the numbers mean.
CFM as suitability evidence
Cashflow modelling output should be embedded in the suitability report, not appended as a separate document. When the suitability report says "the recommended drawdown strategy is sustainable based on your circumstances", the supporting CFM output should be immediately available to show what analysis underpins that statement. This demonstrates that the adviser considered sustainability, not just suitability at the point of recommendation.
The CFM output in the suitability report should show: the base case projection with the recommended income and investment strategy, at least one stress scenario showing the impact of adverse market conditions in early years, a longevity scenario showing outcomes if the client lives to 95 or 100, and the income adjustment that would be required if the stress scenario materialised. Each scenario should link back to specific fact-find data — the income need, the fund value, the state pension timing — creating a traceable chain from client data to modelled outcome.
For file review purposes — whether internal QA, external compliance audit, or FCA examination — this integration is decisive. A file where the suitability report includes embedded CFM showing stress-tested scenarios is demonstrably stronger than a file where CFM exists as a separate document that may or may not have informed the recommendation. It provides auditable evidence that the adviser considered sustainability, performed stress testing, and communicated the results. Under Consumer Duty, this is the standard the FCA expects.